
Google Analytics gives you plenty of information about your website. The problem is that “plenty” can quickly become “too much”, especially when every graph appears to be waving for attention like it has something urgent to say.
If you are just getting started with GA4, the trick is not to track everything. It is about understanding which metrics actually help you see whether your website is bringing in the right visitors, keeping them engaged, and turning interest into action.
This guide breaks down the Google Analytics metrics that matter most, how to set up useful reports, and how to spot problems before they quietly cost you leads.
What's inside? (TL;DR)
This article explains which Google Analytics numbers are worth watching and which ones can safely stop shouting for attention.
It covers visitor behaviour, engagement, traffic quality, conversion tracking, and how GA4 works with Search Console to show what needs fixing.
Useful Sections
Estimated reading time: 4 Minutes
Essential Google Analytics Metrics
Four key measurements show SEO success in Google Analytics. These numbers will usually be prominent in your GA4 dashboard.
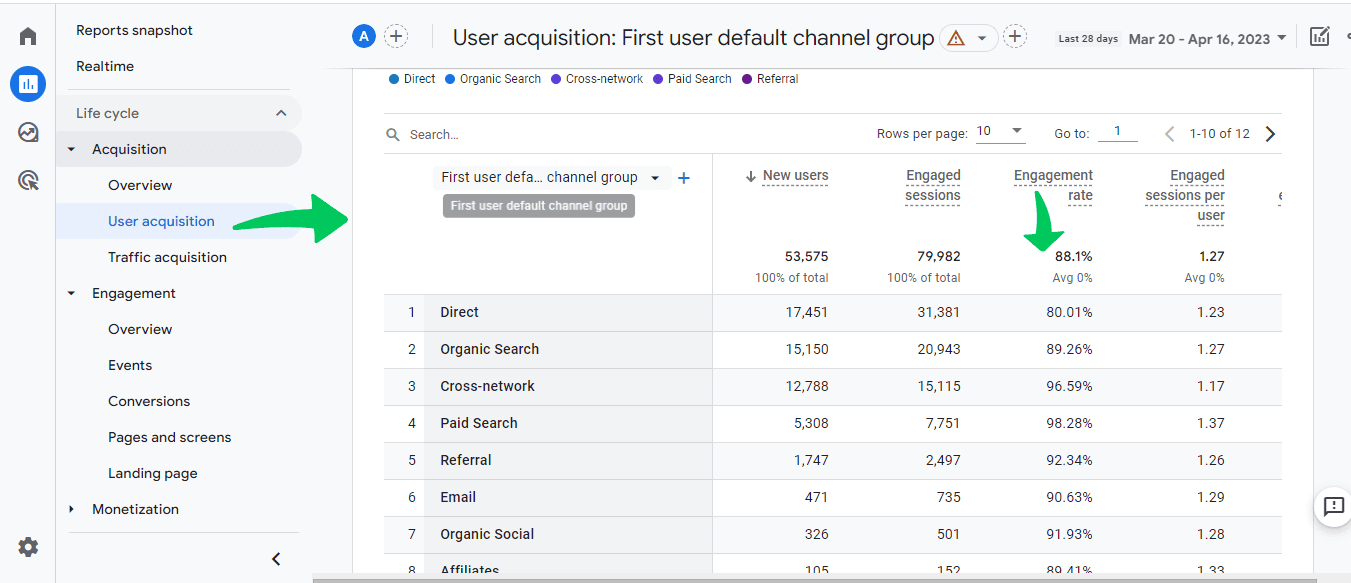
Your visitor count appears in the User acquisition report.

When this number rises steadily month by month, your online visibility is growing. A sudden drop might mean technical problems need attention. If weekday numbers are much higher than weekend numbers, you are probably attracting business customers. Higher weekend traffic often suggests retail or consumer interest.
Engagement rate, found in the Engagement overview, shows average interaction time. When visitors spend four minutes or more reading your service pages, they are likely considering your business seriously. Quick exits under 30 seconds might mean unclear content, weak page layout, or the wrong audience arriving on the page.
Setting up custom events helps you track specific actions, such as scroll depth on important pages.
Click data integrates from Google Search Console into your GA4 Acquisition reports. Watch for patterns. Rising clicks but falling conversions could mean your search listings are attracting the wrong audience. If specific pages get plenty of impressions but very few clicks, it may be time to improve their titles and descriptions.
Setting Up Essential Reports
Create a custom report to track your core business metrics. In GA4, click Reports, then New Report. Start with these measurements:
Average engagement time by page
Events that lead to conversions
Landing pages that keep visitors the longest
Traffic sources that bring return visitors
When setting up conversion tracking, begin with your contact points. Track phone clicks by adding an event tag to your number. Monitor form submissions through enhanced measurement settings. Create a custom event for file downloads that triggers when someone downloads your price list, brochure, or other key resource.
Understanding Traffic Quality
GA4’s traffic source reports reveal differences in visitor quality.
A high bounce rate from social media might mean your posts are promising something your website does not deliver. If organic search brings longer visits but few conversions, your content may need clearer calls to action.
Real examples show this clearly. When organic search visitors spend twice as long on the site as social visitors, your search optimisation may deserve more attention. If mobile users leave contact pages quickly but desktop users convert well, your mobile contact form probably needs work.
Finding And Fixing Problems
Google Analytics and Search Console work together to help you spot issues.
In GA4, connect Search Console through the Admin panel’s Property Settings. Once connected, you will see detailed search performance data alongside your analytics.
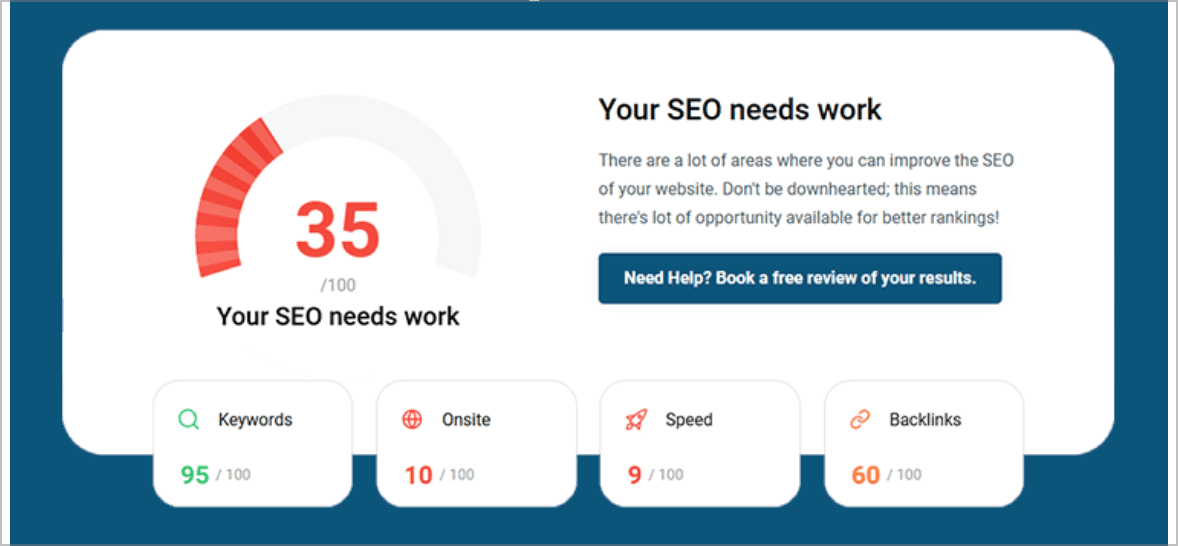
Technical issues that affect rankings are becoming increasingly important, so monitoring these metrics is crucial.
Watch for warning signs:
If your Web Vitals report shows an average page load time exceeding three seconds, check image sizes and hosting performance.
Search Console’s Mobile Usability report can show specific page issues when mobile traffic drops suddenly in acquisition reports.
If organic landing pages show high exit rates, check Search Console’s Coverage report for indexing problems.
Measuring Business Impact
Set up conversion tracking based on your business goals.
An e-commerce site should track the shopping journey from product list views through cart additions to purchases. Service businesses need form submission tracking, call tracking, and chat initiation events.
For example, a high product view count but low cart additions often means pricing is not transparent enough. Strong cart additions but few completions usually point to checkout friction, such as too many form fields or unclear shipping costs.
Understanding Search Performance
With GA4 and Search Console connected, your acquisition reports show more complete search data.
Track which queries bring engaged visitors by creating a custom report that compares search terms with engagement time.
Page performance reports in Search Console can help explain ranking changes. When important pages get fewer clicks, check whether their average position has dropped. Position drops without content changes often mean competitors have improved their pages or new competitors have appeared.
Taking Action On Analytics Data
Good analytics data guides better decisions.
When you see new trends, investigate them before making changes. A traffic drop from Google might need technical fixes found in Search Console. Lower conversion rates might mean recent content changes have missed the mark.
The KickstartSEO Portal helps simplify this process, turning Google Analytics data into clear actions you can take to improve your results.
Can We Help?
Many people end up on our blog because their SEO is not working as they hoped, and they are trying to figure out what to do next. Sound familiar?
If your analytics are giving you more confusion than clarity, that is usually a sign that the numbers need translating into plain English.
We can help you understand what your website data is really saying, where visitors are dropping off, and which fixes are most likely to move the needle.